どこに打ち、どこで流れが変わったか。Where did you hit it, and where did the match turn?
ストロークごとの記録から、配球・ラリー展開・得点の流れを可視化するバドミントン分析ワークベンチ。コーチ、アナリスト、選手が、それぞれの判断に使えます。A badminton analysis workbench that turns stroke-by-stroke records into shot placement, how rallies develop and how the score flows. Coaches, analysts and players can each use it to inform their own decisions.
登録後、内容を確認してから利用できるようになります。Your account becomes usable after it has been reviewed.
サンプルデータSAMPLE DATA配球ゾーンと、1ラリーの配球順Placement zones and one rally's shot order
少Low多High
架空の1試合データによる表示例です。数字は相手コートへの配球の割合、1〜5 は1ラリー内の着地の順番です。An illustration with made-up data from one imaginary match. Numbers are the share of shots to each zone of the opponent's court; 1-5 are landing points in order within one rally.
次の練習を考えるための、3つの見方Three views to plan your next practice
記録した試合から、次に何を試すかの手がかりになる表示を用意しています。From the matches you record, ShuttleScope gives you views that suggest what to try next.
サンプルデータSAMPLE
ネット側が上。色が濃いほど着地が多いゾーン。Net side is up. Darker zones received more shots.
セット間で、配球の変化を比べるCompare placement across sets
同じ選手の配球を、セットごとに9つのゾーンで並べます。どのコースが増え、どのコースが減ったかが分かります。Compare one player's shot placement set by set across nine court zones, and see which areas gained shots and which lost them.
決められることWhat it helps decide次の練習で増やしたいコースの目標。Which areas of the court to work on in your next practice.
サンプルデータSAMPLE
上段(塗り)=自分、下段(白抜き)=相手。7球目(橙)で得点。Top row (filled) = you, bottom row (outlined) = opponent. Point won on shot 7 (orange).
ラリーを、1球ずつ並べるLay out the rally, shot by shot
サーブから決まり球まで、球種と順番を1列に。得点につながった組み立てを振り返れます。Every shot from the serve to the finishing stroke, in order and by type, so you can look back at the build-up that earned points.
決められることWhat it helps decide次の試合で試す、得点につながる組み立て。Which scoring patterns to try in the next match.
サンプルデータSAMPLE
帯は推定の幅。記録が少ないほど広がります。The band shows the range of the estimate and widens when less is recorded.
得点の流れを、折れ線で追うFollow the flow of points
ラリーごとの優位度の推移を表示します。流れが動いた局面から、見返したい場面を選べます。See how the advantage moves rally by rally, and pick the moments where the flow changed to review.
決められることWhat it helps decide映像で見返す場面と、伸びしろのあるプレー。Which moments to review on video, and which plays have room to grow.
どの表示も、記録された範囲の傾向を示すものです。試合数やラリー数が少ないときは信頼度を併記し、断定はしません。Every view shows trends within what was recorded. When there are few matches or rallies, a confidence level is shown alongside and results are never presented as certain.
分析方法How it is calculated
推定には Markov モデルと EPV (得点期待値) を用いています。Estimates use Markov models and EPV (expected point value).
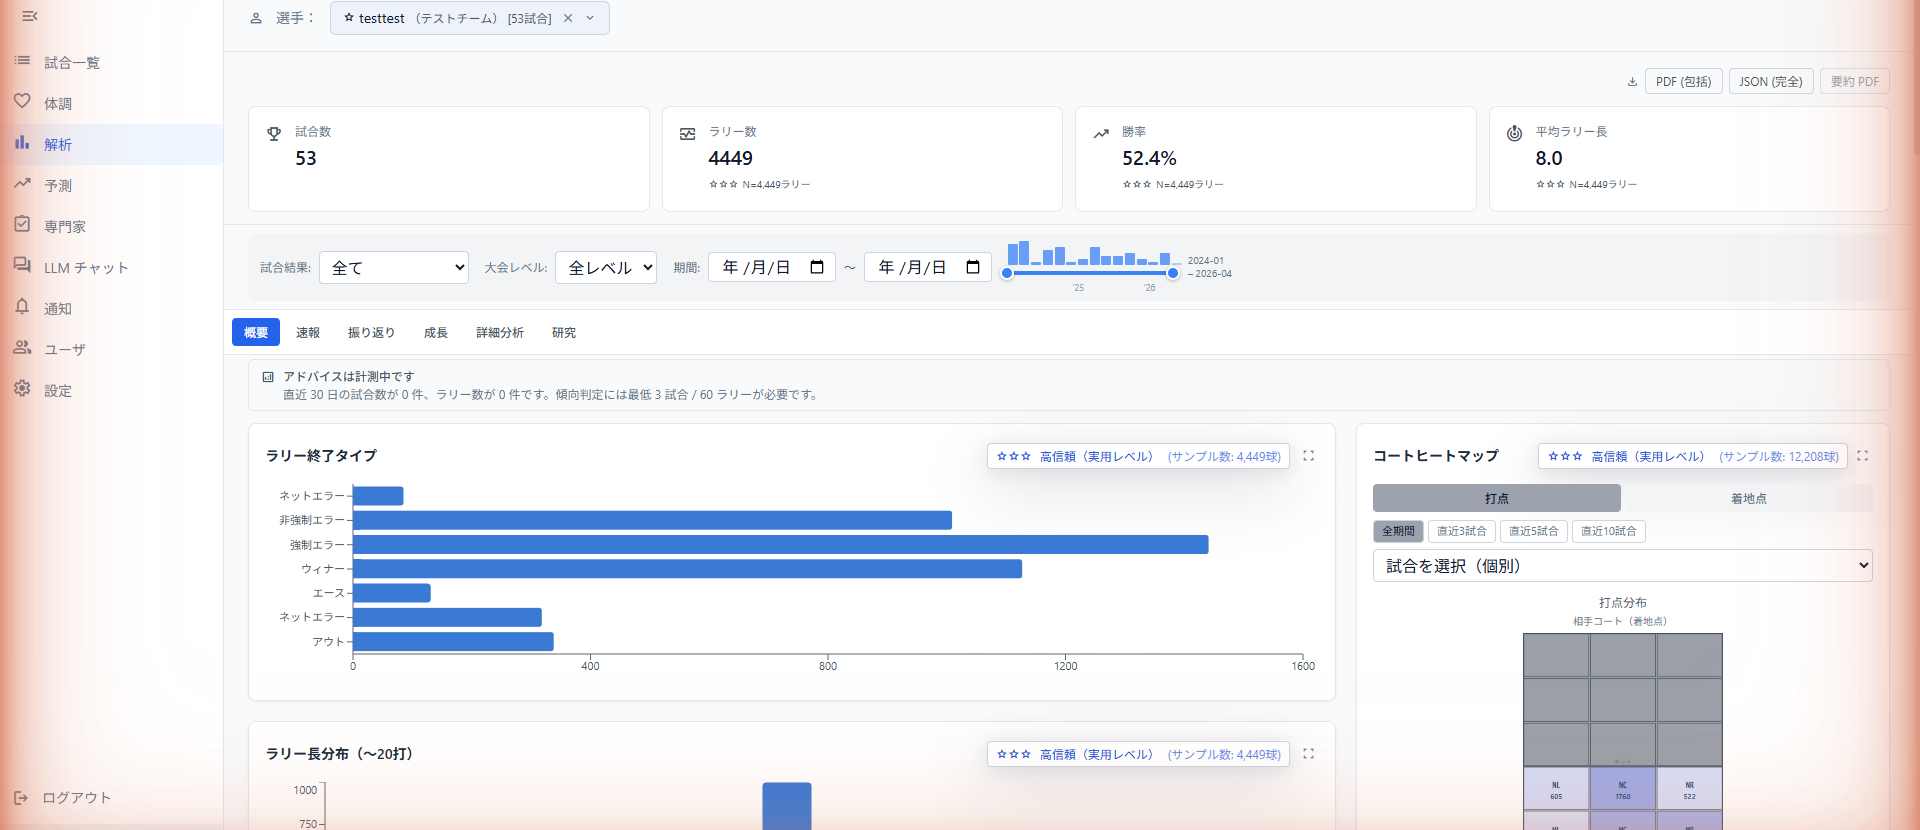
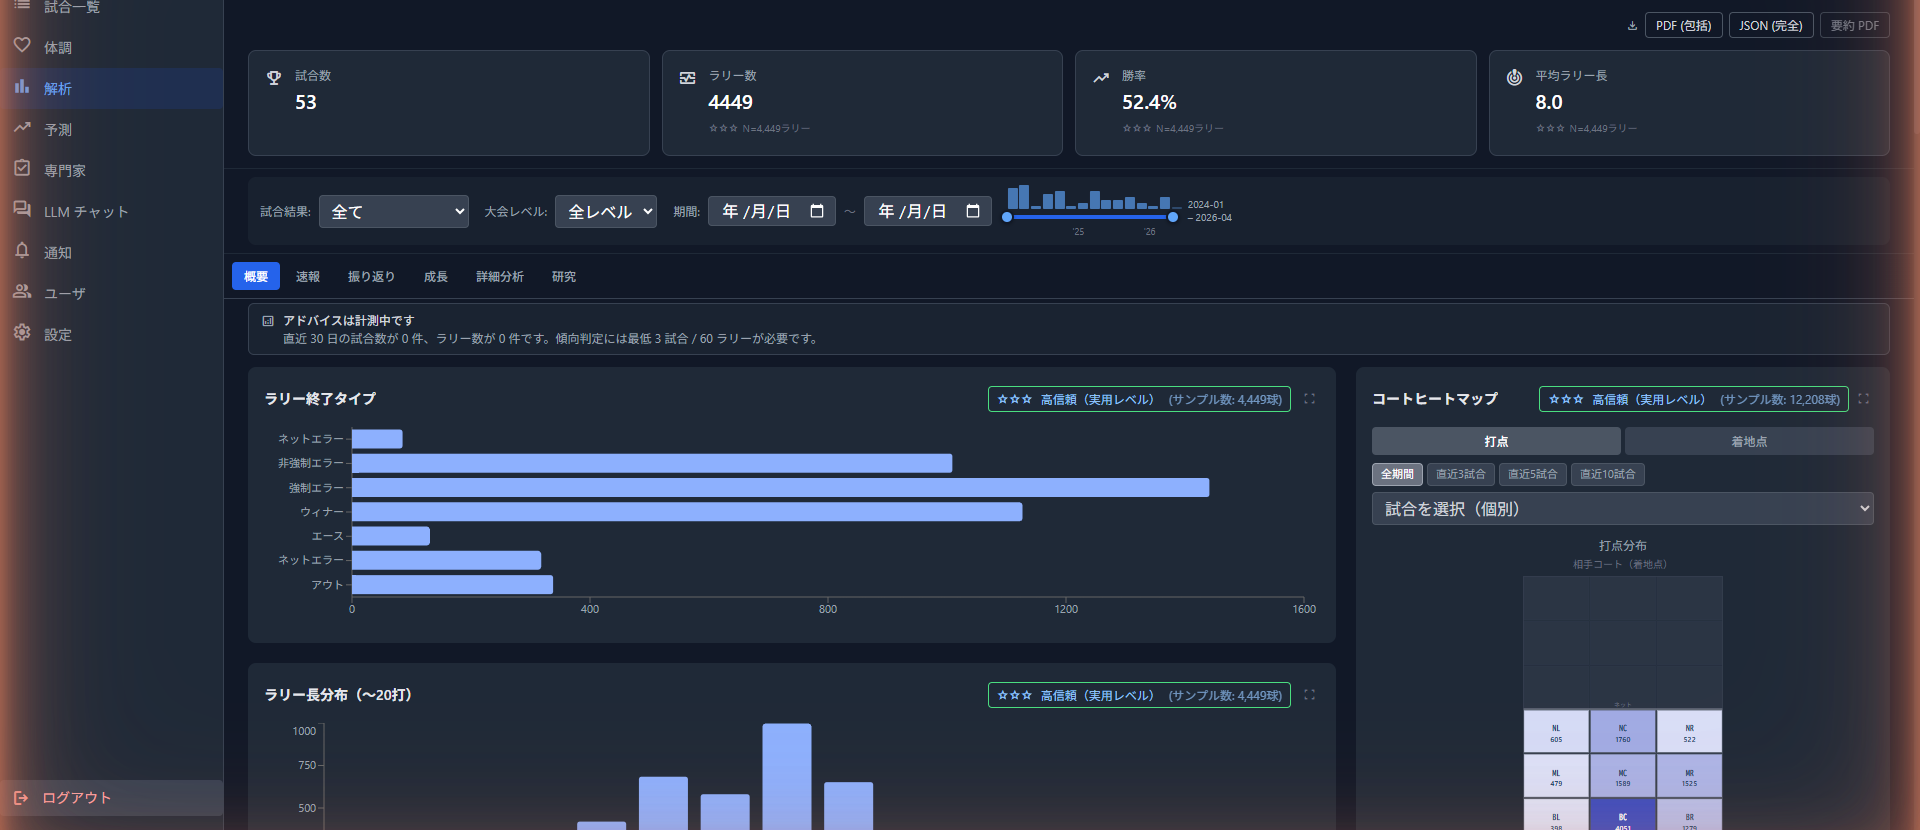
実際のアプリ画面The actual app
同じ試合の記録を、役割ごとの見方で。参照できる情報の粒度は役割によって異なります。The same match record, viewed by role. The level of detail each person can see depends on their role.
解析ダッシュボード。開発用のテストデータで表示しています。The analysis dashboard, shown with development test data.
コーチCoach
チーム全体の傾向を見て、練習の優先順位を決める。Read team-wide tendencies and set practice priorities.
アナリストAnalyst
ストロークと局面を掘り下げ、対戦相手の傾向をまとめる。Dig into strokes and phases and summarise an opponent's tendencies.
選手Player
自分の試合を振り返り、伸びしろのあるプレーを見つける。Look back at your own matches and find plays with room to grow.
ShuttleScope では利用目的に応じて試合映像・レビュー情報・選手に関する入力情報を扱う場合があります。具体的な取扱方針は プライバシーポリシー を、利用条件は 利用規約 をご確認ください。ShuttleScope may handle match footage, review information, and player input data depending on the purpose of use. See our Privacy Policy and Terms of Use for details.
まずは1試合の記録から。Start with one recorded match.
2026年中は無償です。登録後、内容を確認してから利用できるようになります。Free through 2026. Your account becomes usable after it has been reviewed.